PulseBench-Tab
An open, multilingual benchmark for evaluating table extraction from document images. 1,820 real-world tables spanning 9 languages, scored with T-LAG, a graph-based metric that captures both structural fidelity and cell-content accuracy in a single number.
 HuggingFace Dataset
 Leaderboard
Overall T-LAG F1 scores across all 1,820 samples. Providers are scored only on samples they successfully processed. Pulse Ultra 2 achieves a 93.5% mean score with perfect extraction on 57.9% of the dataset.
Sample Gallery
Browse the benchmark dataset. Click any sample to view the source document and each provider's extraction output.
Head-to-Head
Select any provider to compare T-LAG scores against Pulse Ultra 2. Overall performance and per-language breakdown side by side.
Example extraction
By language
Dataset
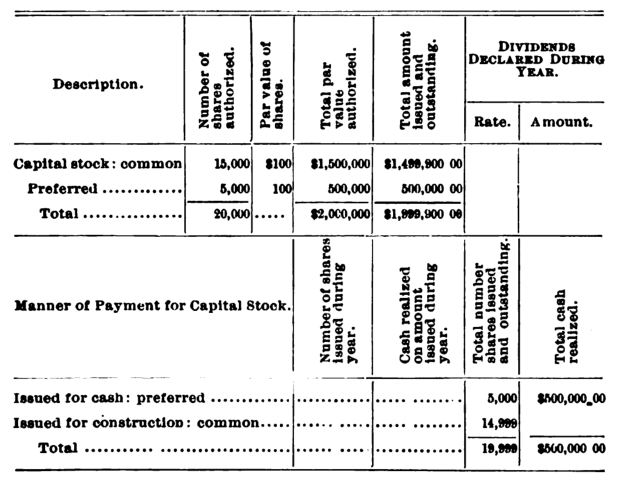
PulseBench-Tab draws from 380 real-world documents including financial filings, government reports, medical records, academic papers. Tables range from simple 2-cell headers to dense 1,183-cell spreadsheets. Ground truth was human-labeled by subject matter experts.
Performance by Language
Table extraction quality varies dramatically across scripts. Arabic and Korean are the hardest. Most providers drop 15-30 points on non-Latin languages. Pulse Ultra 2 stays above 91% on every language.
| Language | Pulse Ultra 2 | Claude Fable 5.1 | Gemini 3.8 Flash | GPT-6 Astra | GPT-5.6 Sol |
|---|---|---|---|---|---|
| 🇺🇸English589 | 91 | 90 | 89 | 89 | 88 |
| 🇨🇳Chinese213 | 96 | 90 | 89 | 90 | 89 |
| 🇪🇸Spanish176 | 94 | 90 | 91 | 89 | 87 |
| 🇷🇺Russian170 | 94 | 93 | 92 | 92 | 92 |
| 🇫🇷French165 | 97 | 93 | 93 | 92 | 92 |
| 🇯🇵Japanese164 | 96 | 89 | 89 | 88 | 88 |
| 🇸🇦Arabic146 | 92 | 77 | 74 | 78 | 77 |
| 🇩🇪German113 | 95 | 90 | 89 | 89 | 89 |
| 🇰🇷Korean84 | 94 | 87 | 86 | 89 | 90 |
How T-LAG Works
T-LAG models each table as a directed graph of cell adjacencies, then finds the optimal matching between ground truth and prediction graphs. Unlike TEDS which operates on DOM trees, T-LAG evaluates the 2D logical structure directly.
What is T-LAG?
T-LAG (Table Logical Adjacency Graph) represents each table as a directed graph where nodes are cells and edges connect horizontally or vertically adjacent cells. The score measures how well the predicted graph matches the ground truth graph, capturing both structure and content in a single F1 metric.
Why not TEDS?
TEDS (Tree Edit Distance Similarity) is the most common table evaluation metric, but it has well-documented weaknesses. It operates on the DOM tree rather than the logical 2D grid, so it conflates formatting changes (like wrapping cells in <thead>) with actual structural errors. It also scales poorly for large tables.
Pipeline
Build adjacency graphs
Parse each HTML table into a grid, then extract directed edges. RIGHT for horizontal neighbors, BELOWfor vertical. Spanning cells are deduplicated so merged regions don't dominate.
Weight edges with the Psi kernel
For each candidate pair of ground-truth and predicted edges, compute a similarity weight. Cell text similarity uses normalized Levenshtein distance raised to the 7th power, sharply penalizing even small character-level errors.
Optimal matching
Run the Hungarian algorithm on the weight matrix for optimal 1-to-1 edge assignment. Direction-constrained: RIGHT only matches RIGHT, BELOW only matches BELOW.
Score
Compute weighted precision, recall, and F1 from the matched edges. The F1 is the final T-LAG score. No additional structural penalty needed. Errors are captured through unmatched edges.
Read the full research paper
Get the complete methodology, evaluation details, and per-language analysis.